Equipment OEE Summary Equipment OEE Summary |   |
|
Equipment OEE Summary | |
Overview
OEE Chart Overview
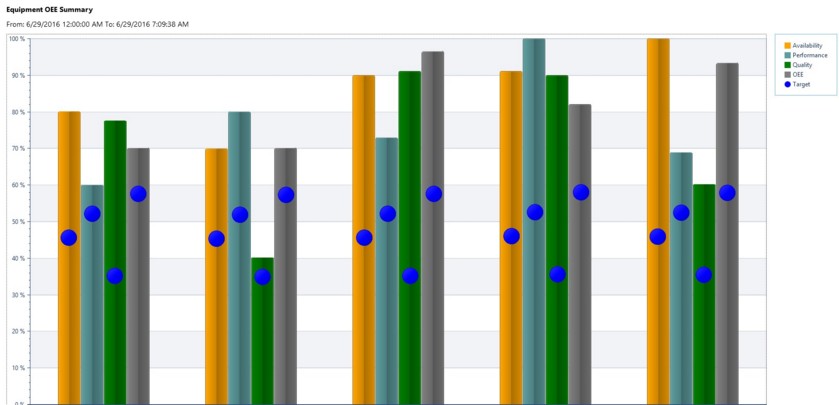
The OEE Summary Chart, is a 4 tier bar graph for analyzing OEE specific metrics. The chart is capable of of displaying Availability, Performance, Quality and OEE data. It is also possible to plot the targets for each metric alongside the returned values. Use the filter to customize the chart by selecting which values should be displayed when generating the chart.
The Settings section:
Find Further details on OEE calculations here.
- The Metric Options are used to select what should be displayed on the RTV screen being created.
-OEE Toggle visibility on or off
-Availability Toggle visibility on or off
-Planned Time Toggle visibility on or off
-Performance Toggle visibility on or off
-Quality Toggle visibility on or off
- The Settings
Font size: This Option is used to change the Size of the font to better fit your screen
Reset Interval: This option allows for the customization on the starting point for the data
Legend: An option to toggle the Legend on or off
RTV OEE Summary Chart Example
|
|