Browser Data Display Application Browser Data Display Application |   |
|
Browser Data Display Application | |
Overview
The Scytec DataXchange Data Application runs as a web site in a browser and as an app on mobile devices. The following describes the basic usage of the app such as the initial login as well as some of the features and use cases for a few of the items.
Logging In
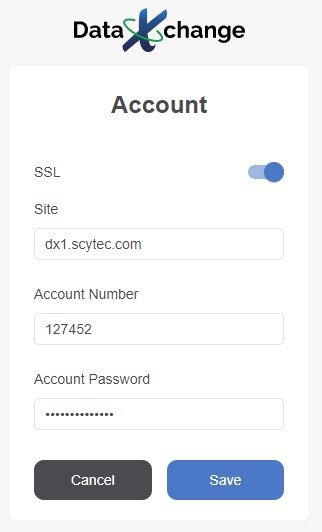
The first time the application is run on a device the account information must be entered, therefore the Account Setting page will be displayed. If utilizing the DataXchange Cloud service the default URL of dx1.scytec.com must be used with SSL enabled. If utilizing an On Premise deployment then the appropriate site and SSL settings must be entered.
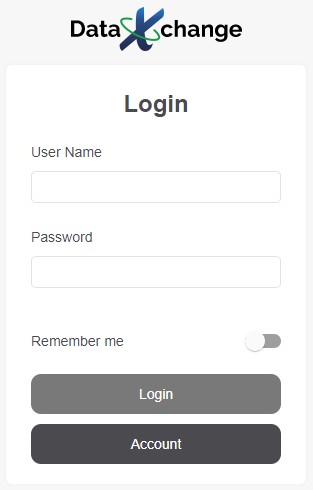
Once the account information has been saved the login screen will appear. Considering the app is designed to work from browsers and mobile apps from outside the organization corporate network only DataXchange authentication is supported. LDAP and Microsoft Active Directory authentication is not supported for the reporting application.
|
|
|
Navigating the Reporting Application
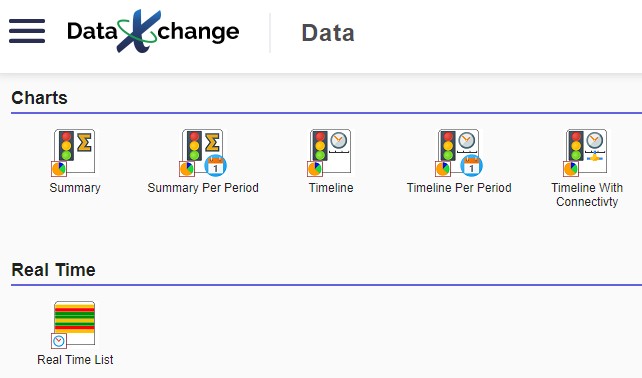
Once logged in the application will be on the main Data page which is where the charts and dashboards can be launched. Pressing any of the icons will navigate to the Filter page for the associated Data View. Each icon is controlled by permissions within the main DataXchange application.
The menu bar on the left allows navigation back to the Data page once on one of the Data Views. The Show Tabs options determines the location of the Filter and Display buttons which appear when on a Filter page or a Data View page.
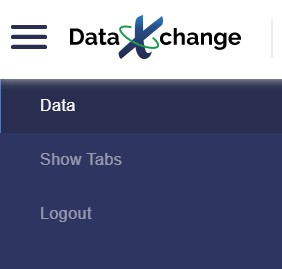
The default is to show the tabs.
However, once there is familiarity with the application displaying the button as icons provides additional screen space for the Data Views.

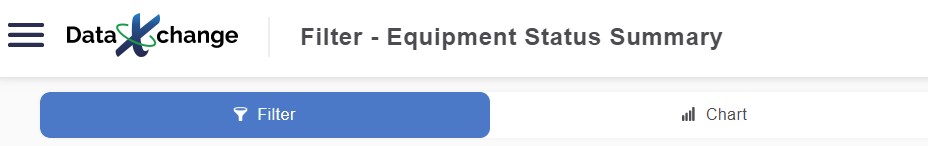
Using the Filters
The filters in the browser and mobile reporting are designed to remember the selections for each user. All applicable settings will carry over between charts as well. For example, Let’s say four pieces of equipment are selected for last Tuesday from 6:00 AM to 10:00 AM when running the Equipment Status Summary chart. Then, when going to the Equipment Status Timeline chart the filter will have the same settings by default. The settings are also retained regardless if the filter is used on a PC, a browser, or within one of the mobile applications.
Equipment Status Timeline
When there is a lot of equipment status activity and the equipment status timeline chart is run for a larger period of time it is difficult to determine the detail and all of the statuses with shorter time frames simply cannot be shown. To address this issue the equipment status timeline has the capability to show the status detail by holding the cursor over the data and to zoom in on the data. Let’s take a look at how the zooming works.
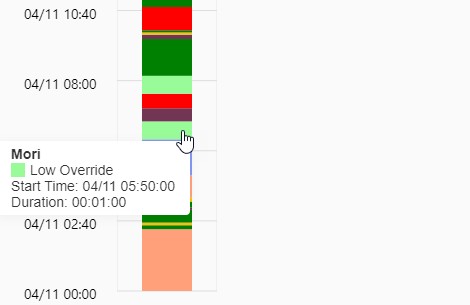
We would like to dive into the data around 6:00 am when the machine was running in low feed rate override which is shown in light green.
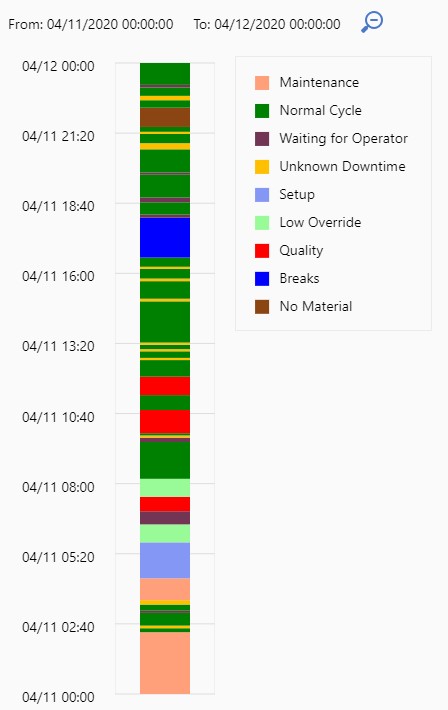
If we hold the cursor over the Low Override status we can see the status started at 5:50 am and lasted exactly 1 minute.
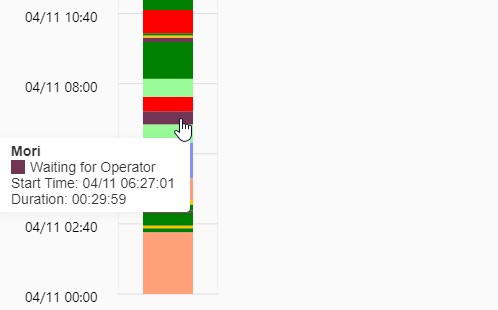
Now, if we hold the cursor over the status Waiting for Operator, the status directly above Low Override we can see that the status started at 6:27 am. Based on the previous data we would have expected this status to start at 5:51. This discrepancy tells us that there are additional equipment status records in between these two statuses. Let’s zoom in on this area to see what’s going on.
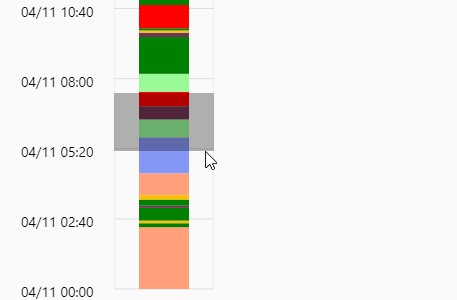
To zoom, ensure the cursor is anywhere within the grid area of the chart then click and drag. Release the mouse button after dragging over the area to be zoomed in on.
Now we can easily see all of the detailed activity that has taken place around the time frame in question.
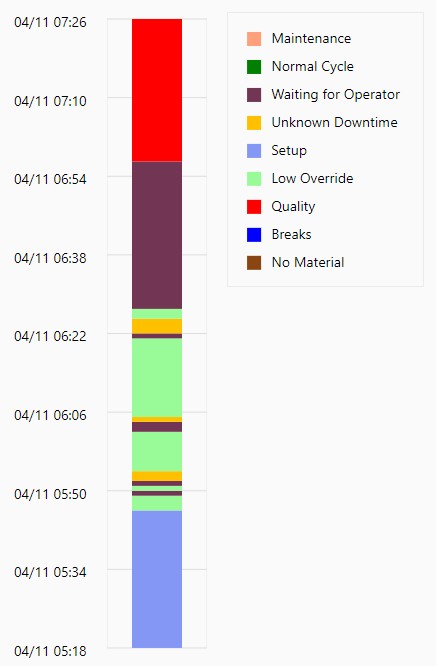
The data can be zoomed in again by dragging over the desired area. The zoom percentage can be reset by clicking the magnifying glass icon at the top of the chart.
![]()
Equipment Status Timeline with Connectivity
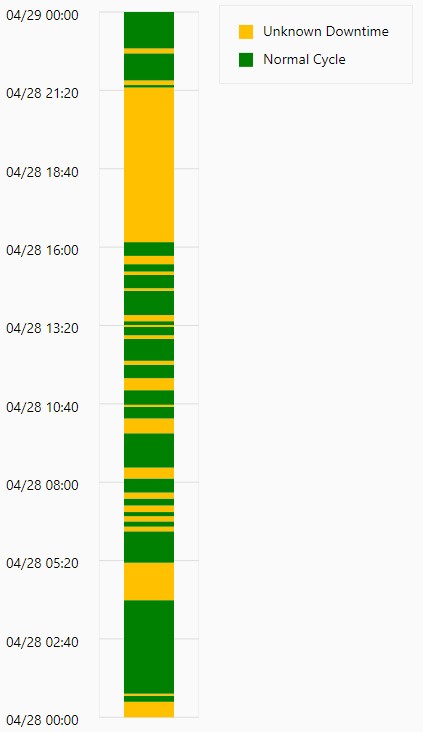
The Equipment Status Timeline with Connectivity chart presents both the equipment status events and the connectivity health events next to a time scale. Why would this be helpful? Let’s take a look at the timeline on the left side. The large block of yellow is concerning. Why did the machine not run for five hours? Was there a problem with the machine that wasn’t reported? Is the data collection system working correctly?
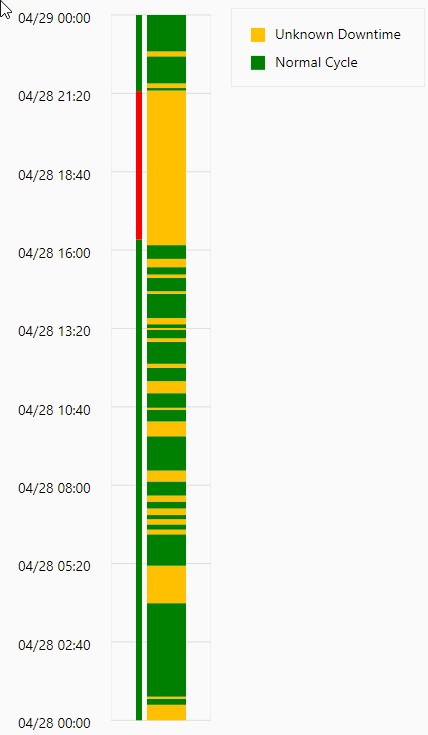
However, if we look at the timeline on the right side, we can see the connectivity health events clearly showing the connection to the machine was lost preventing the data collection system from capturing the data. Now we know the data collection system is working and there was more than likely a networking issue to the machine that caused the problem.
|
|
|