Summary Per Period Chart Summary Per Period Chart |   |
|
Summary Per Period Chart | |
Overview
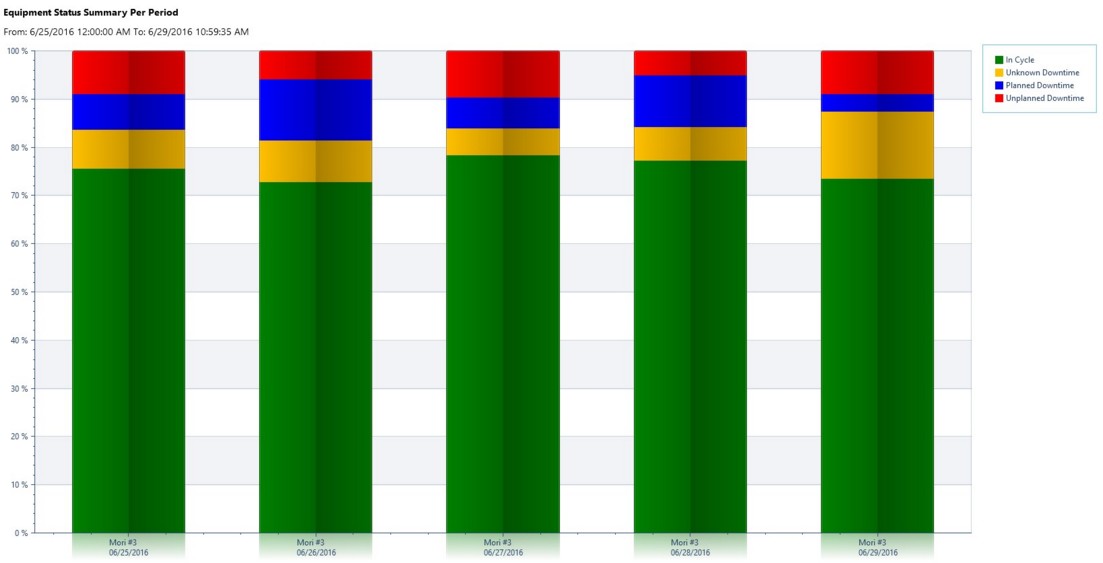
The Equipment Status Summary Per Period chart displays the percentage of time that each piece of equipment has been in each status for the time frame selected. This chart can assist further by allowing the ability to compare single or multiple pieces of equipment by a selectable timeframe or to detail out shifts against each other.
Required and Optional Information
A time frame and one or more pieces of equipment is required to generate the chart. Using the Quick Select default, the Last Two Days is selected for the time frame. Weeks can also be selected, the default being 2 weeks and the Starting Day, Monday. Once the equipment has been selected the chart can be generated without specifying any additional information.
General and Specific Status
For the Cycle status either an individual specific status can be selected or all of the specific statuses can be selected. As an example, there are two specific statuses in use, Machine Time and Spindle time. Machine Time has been setup to be active any time the equipment is running. Spindle Time has been setup be active only when there is a load on the spindle. By selecting Machine Time vs. Spindle Time as the specific status the comparison chart will utilize the appropriate amount of time as the cycle time and therefore providing different results for the percentage of time the equipment has been in cycle.
For Planned and Unplanned Downtime either the General Status can be viewed or the General Status can be broken down showing each of the Specific Statuses.
Additional Options
Once a chart is generated a gear or Options button will appear in the upper right hand corner. These options will vary based on the chart generated, and these Options are not available on all charts, therefore at times the options panel will remain blank or unavailable.
This Additional Options panel also contains printing, viewing and exporting options for the generated chart.
Example of a Summary Per Period chart
Note, this example shows the results of one machine over the course of 5 consecutive days. The results are also being displayed as general status times.
|
|