Average Operation Time Report Average Operation Time Report |   |
|
Average Operation Time Report | |
Overview
The Average Operation Time report is used to find the average operation time per part within a specific period of time. The report is broken down and displayed by part.
The filter can be used to display specific parts by selecting the check boxes to filter down selections. By default all parts are selected but it is possible to search and further narrow down your results by typing into the text box above.
Required and Optional Information
A time frame and one or more parts are required to generate the chart. By default, Today is selected for the time frame. Once the equipment has been selected the Finish and Next buttons become available. At this point the chart can be generated without specifying any additional information by pressing the Finish button. Additional optional information can be selected by pressing the Next button.
On the second page there are options for:
Displaying by Group: Enables group reporting by part number
Part Count Type: Select from Good or Good and Scrap
Equipment List: Select the equipment for the report.
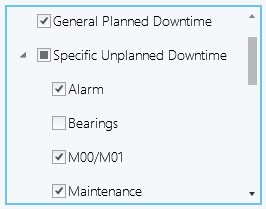
It is possible to further filter the chart to only display desired specific statuses. To do this, use the check boxes to indicate which statues should be displayed when generating the chart. If the status box is checked and there is historical data, it will be displayed.
|
|
|
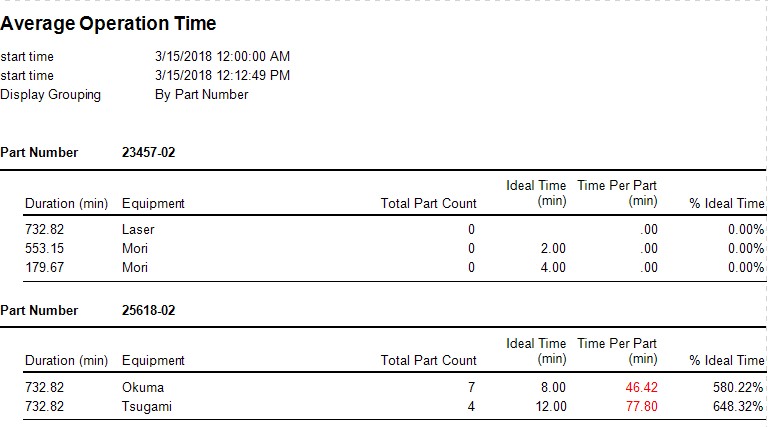
Average Operation Time Report Example |
|
|