Utilization Per Period Chart Utilization Per Period Chart |   |
|
Utilization Per Period Chart | |
Overview
The Utilization Per Period chart displays a desired utilization number next to the actual utilization for each piece of equipment over the course of a selected time period. Details are broken out so that you can compare details of specific machines over a time period. Colors are used to identify how close the actual values are within the defined targets. The definition for utilization is set using the filter options this includes the percentage for each of the utilization colors as well as choosing a view.
Required and Optional Information
A time frame and one or more pieces of equipment are required to generate the chart. By default, Last Two Days are selected for the time frame. Once the equipment has been selected the Finish and Next buttons become available. At this point the chart can be generated without specifying any additional information by pressing the Finish button. Additional detail information can be selected by pressing the Next button. After clicking the Next button the second page of the filter can be used to select the type of statuses to be compared. By default the General status is selected but you can choose specific if desired.
Utilization
Chart Type: Choose between Single Column and Clustered Column depending on viewing preference.
Target: The color that will be used for the value specified on this page.
On Target: The color that will be used if the actual value is within or above the specific target range.
Below Target: The color that will be used if the actual value is below the specific target range.
Off Target: The color that will be used if the actual value is lower than the Below Target range.
The percentages used to set the limits for the different level are defined on the filter page for the Utilization charts.
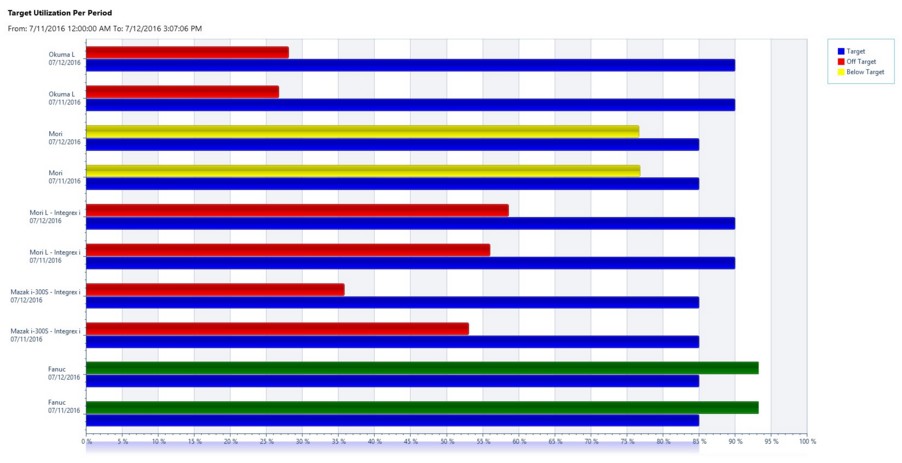
Example of a Utilization Per Period chart
|
An example of a Utilization clustered column per period chart using 5 machines over two days |
|
|
|
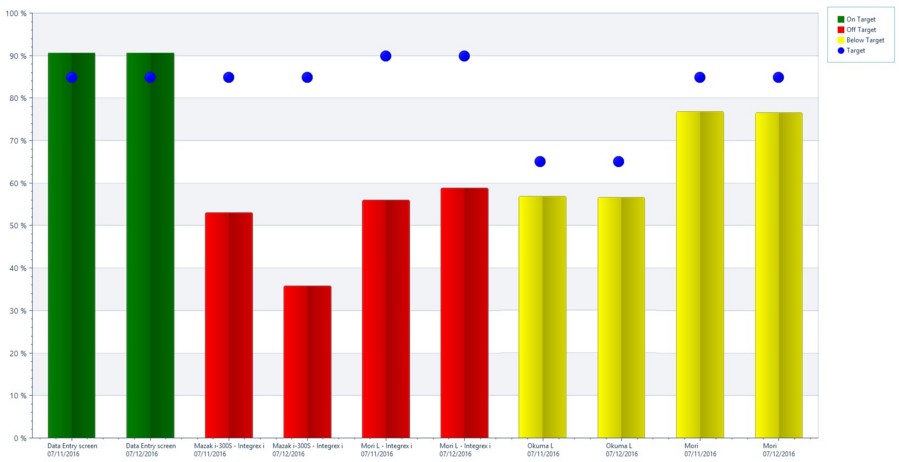
An example of a Utilization single column per period chart using 4 machines over two days |
|
|